
How to Use Multiple Charts Without Creating Visual Clutter
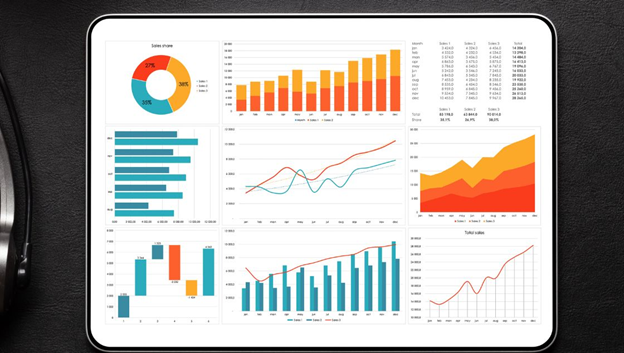
When presenting data, using multiple charts can help tell a full story, but it can also quickly lead to visual clutter. Imagine you’re trying to tell a friend about your monthly expenses but instead of giving a clear picture, you show them a jumble of graphs for every small detail—things...